A few words first and then I'll get into the nitty-gritty of what the images are. While I started to look at this in order to see if there was a way to compute the one sigma error in the transverse components, as input for the ambiguity resolution module, a this is a much broader issue since everyone, all modules and analysis, downstream need to have a good idea of what the uncertainties in the measurements are. I strongly believe that this needs to be part of any kind of data release, test or otherwise. It is an issue for both full disk users and HARPS users.
The Hope: the covariance matrices would appropriately track the noise levels.
The Finding: the large scale structures are confirmed to be most likely an input-data issue, which may shift the location of the minimum for the inversion, but does not change its shape inherently. So, the returned covariance values do not track the large spatial (and by extension, temporal) variations that are observed in the signals, And as such cannot be used directly to determine a threshold for the ambiguity resolution or for any other indication of noise.
The Method: assumed that the uncertainty in a fitted parameter is given by the square root of the covariance. Propagate the uncertainties to obtain the error in the transverse component. Assume that since the fill fraction is not fit, that it is unity and its uncertainty is zero. (More on that later.) For the moment, I only did one time: 2011.02.15:00.
The Images (including helpful explanations, I hope):
Image 1: Large-scale pattern is evident in B_Trans, and it's not radially varying (i.e. just f(mu))
as one might expect from just RT. Scaled 0-200.
![]()
Image 2: The 1-sigma error in B_trans, calculated from propagation of errors from the covariance output of the inversion, also scaled 0--200.
![]()
Image 3: Same 1-sigma error as above, scaled 0-10. Note spatial pattern does not really look like b_trans itself and does not pick p the large-scale variation seen in B_trans.
![]()
Image 4: An image of the sqrt(chi^2), scaled 0-5. Pretty wild with evidence of picking up large-scale fringing, or Doppler modes or...something.
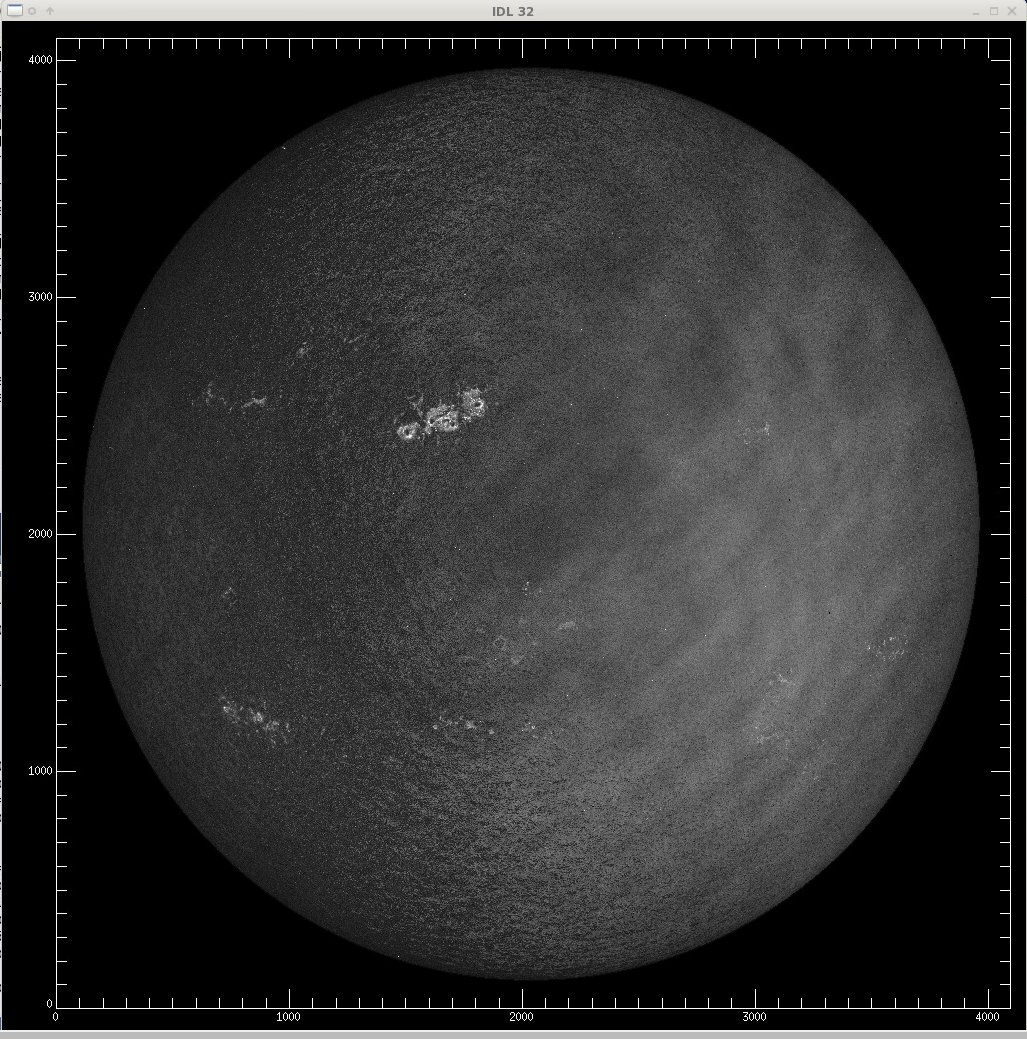
Image 5: B_trans scaled 0-200 like above, contours (Black) indicate
where B_trans > 3*btrans_err. This would, for example, indicate
where over the disk the pixels would be annealed, or not. So, we're
back to the problem that the uncertainties as computed from the
returned covariances do not pick up the large-scale variations in
signal that are needed for the ambiguity resolution. Or for anything
else downstream.
![]()
Image 6: by examining the distribution of the transverse field component in
64^2 tiles, and taking the Btrans strength at which 68% has been
tabulated in a histogram, one can do a post-facto estimation of the
noise, i.e. what is the signal when there should be none. Note that
the black areas are where the field strengths in the super pixel were
too strong for this to be appropriate. In this manner the
large-scale structure of the 'noise' can be recovered to some extent.
But this would have to be done for each and every data set until and
unless a functional form and its temporal variation (with a known and
rock-solid period) was established.

Comment on fill fraction: if it is included in the propagation, with an attitude unity everywhere but uncertainty unity everywhere as well, then one covers essentially be trans for the uncertainty plus a small delta -- that delta being thebtrans_error that I calculated above.
The bottom line for the immediate future is I don't know what to do for a threshold for full disk (or, HARPS for that matter) ambiguity resolution which is not going to be so strong as to miss a lot of area that should be annealed, or end up wasting a lot of time annealing areas that shouldn't be.