Thomas R. Metcalf
Lockheed Martin Advanced Technology Center
metcalf@sag.lmsal.com
Last modified 1996 August 22
Abstract. I examine several simulated HXT Fourier synthesis data sets using both the pixon and the MEM image reconstruction algorithms. As a result of better suppression of spurious sources in the pixon reconstructions, the pixon algorithm is better photometrically. However, the pixon algorithm is an order of magnitude slower than the MEM algorithm. Thus, the pixon algorithm is more appropriate in situations when photometry is important, but the MEM algorithm is more appropriate when photometry is not important (e.g. morphological studies or quick-look imaging). The results of the simulations have implications for the 1992 January 13 "Masuda" flare: the loop top source in the Masuda event has a "gradual" lightcurve during the flare. The HXT data used here indicate that there is not an impulsive component in the loop top lightcurve during the impulsive phase.
I have performed several image reconstructions with simulated Yohkoh Hard X-ray Telescope (HXT; Kosugi et al., 1991) Fourier synthesis data using the pixon (Metcalf et al., 1996; Puetter, 1995) and the MEM (Sakao, 1994) algorithms. The purpose of the simulations is to compare the pixon algorithm with the MEM algorithm when the correct answer is known. The simulations test how well the image is reconstructed spatially and how well the photometry is reproduced in the reconstructions.
The simulations are motivated by the need to understand the HXT lightcurves for the important "Masuda Event" of 1992 January 13 (Masuda et al, 1994). The light curve for the loop top source in the Masuda event is important for our understanding of this event. In particular we would like to know if the loop top source is impulsive or gradual. Since the loop top source must be detected in the presence of much brighter footpoint emission, it is important to understand how the reconstruction algorithms behave for this type of event. Since the HXT is a Fourier synthesis instrument, the bright footpoint emission can swamp the loop top emission even though the footpoints and loop top are spatially distinct.
The HXT data were simulated using the modulation patterns calculated for the 1992 Jan 13 Masuda event. The "true" image is designed to look similar to the Masuda event in that the simulated images have two "footpoints" which are compact sources which become very bright and a "loop top source" which is more extended and has a constant brightness. The data also include a spatially uniform background and noise in each of the 64 data channels. The noise is included using a Poisson distribution to simulate the noise in the HXT.
The simulations focus on how the reconstructions change as the brightness of the footpoints is increased relative to the loop top source. Initially the footpoints have negligible brightness and the reconstruction should detect only the loop top source. In subsequent reconstructions, the footpoint sources become brighter and brighter until they are considerably brighter than the loop top source. As the brightness of the footpoint sources increases, the loop top source eventually becomes statistically insignificant at the pixel level, though the spatially integrated source remains significant in most of the simulations. The transition between these extremes is very illuminating of the differences between the pixon and MEM algorithms.
Table 1 shows the details of the 4 simulations reported on here. The brightness reported in the table shows the maximum brightness of the sources (at the peak of the simulated flare). The lightcurve for the footpoints has a Gaussian shape while the light curve for the loop top source is constant. The uniform background is 0.05 counts per pixel in simulations 1, 2, and 3 and 0.0 counts per pixel in simulation 4. The signal to noise ratio in Table 1 gives the estimated S/N for the loop top source at the peak of the flare when the footpoints have maximum brightness. The "per pixel" S/N is the signal-to-noise ratio for individual pixels in the loop top source. The "integrated" S/N is the signal-to-noise ratio for the loop top source as a whole. In the following section, the figures show the reconstructed images and the lightcurves for each of the simulations. The simulations are ordered from most statistically significant to least statistically significant.
Table 1. Simulation Parameters.
| Simulation 1 | Simulation 2 | Simulation 3 | Simulation 4 | |
| Maximum Brightness per pixel (footpoint/loop top) | 1000/200 | 1000/100 | 100/10 | 75/1 |
| Footpoint 1 Spatially integrated (2x2 pixels) | 4000 | 4000 | 400 | 300 |
| Footpoint 2 Spatially integrated (2x2 pixels) | 4000 | 4000 | 400 | 300 |
| Loop top Spatially integrated (4x6 pixels) | 4800 | 2400 | 240 | 24 |
| INTEGRATED Loop top Signal to Noise (flare peak) | 42 | 24 | 7 | 1 |
| PER PIXEL Loop top Signal to Noise (flare peak) | 1.8 | 1.0 | 0.3 | 0.04 |
3. Simulations
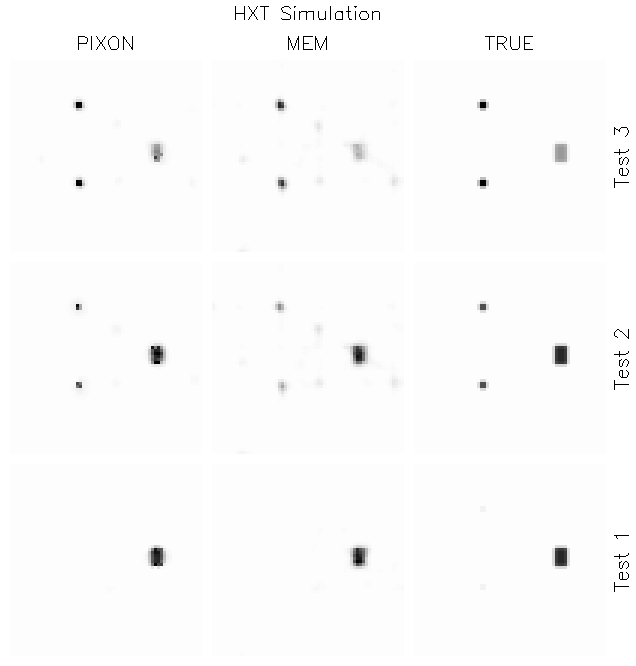
In this simulation, the looptop source has a constant intensity of 200 counts per pixel and the footpoint sources have a maximum intensity of 1000 counts per pixel. The spatially integrated looptop source is statistically significant throughout the flare. The looptop source is also significant at the pixel level throughout the flare.
Figure 1. The Pixon and MEM reconstructions and the "true" images for three different intensities of the footpoint emission. The true loop top emission is 200 counts per pixel (continuous) and the maximum footpoint emission is 10 counts per pixel in the bottom panel and 1000 counts per pixel in the top panel.
Figure 2. Light curves for the spatially integrated loop top source. The solid line is the "true" image, while the dashed line is for the pixon reconstruction and the dotted line is for the MEM reconstruction.
Figure 3. Light curves for the spatially integrated footpoint source. The solid line is the "true" image, while the dashed line is for the pixon reconstruction and the dotted line is for the MEM reconstruction. The light curve for the other footpoint (not shown) is very similar.In this simulation the looptop source has a constant intensity of 100 counts per pixel and the footpoint sources have a maximum intensity of 1000 counts per pixel. The spatially integrated looptop source is statistically significant throughout the flare but, at the pixel level, it is only marginally significant at the flare peak.
Figure 4. The Pixon and MEM reconstructions and the "true" images for three different intensities of the footpoint emission. The true loop top emission is 100 counts per pixel (continuous) and the maximum footpoint emission is 10 counts per pixel in the bottom panel and 1000 counts per pixel in the top panel.Figure 5. Light curves for the spatially integrated loop top source. The solid line is the "true" image, while the dashed line is for the pixon reconstruction and the dotted line is for the MEM reconstruction.Figure 6. Light curves for the spatially integrated footpoint source. The solid line is the "true" image, while the dashed line is for the pixon reconstruction and the dotted line is for the MEM reconstruction. The light curve for the other footpoint (not shown) is very similar.In this simulation the looptop source has a constant intensity of 10 counts per pixel and the footpoint sources have a maximum intensity of 100 counts per pixel. The spatially integrated looptop source is statistically significant througout the flare, but, at the pixel level, it is not significant at the flare peak.
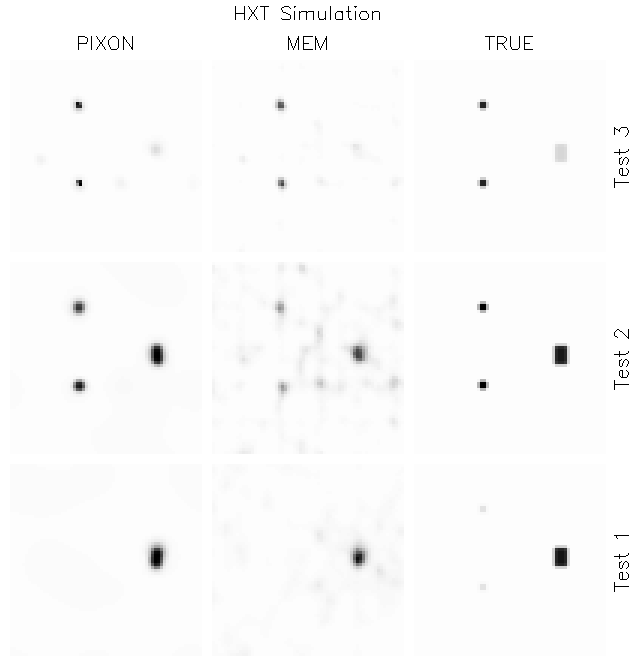
Figure 7. The Pixon and MEM reconstructions and the "true" images for three different intensities of the footpoint emission. The true loop top emission is 10 counts per pixel (continuous) and the maximum footpoint emission is 1 counts per pixel in the bottom panel and 100 counts per pixel in the top panel.
Figure 8. Light curves for the spatially integrated loop top source. The solid line is the "true" image, while the dashed line is for the pixon reconstruction and the dotted line is for the MEM reconstruction.
Figure 9. Light curves for the spatially integrated footpoint source. The solid line is the "true" image, while the dashed line is for the pixon reconstruction and the dotted line is for the MEM reconstruction. The light curve for the other footpoint (not shown) is very similar.
In this simulation the looptop source has a constant intensity of 1 count per pixel and the footpoint sources have a maximum intensity of 75 counts per pixel. The spatially integrated looptop source is margianlly statistically significant throughout the flare, but, at the pixel level, it is not significant at the flare peak.
Figure 10. The Pixon and MEM reconstructions and the "true" images for three different intensities of the footpoint emission. The true loop top emission is 1 count per pixel (continuous) and the maximum footpoint emission is 0.75 counts per pixel in the bottom panel and 75 counts per pixel in the top panel.
Figure 11. Light curves for the spatially integrated loop top source. The solid line is the "true" image, while the dashed line is for the pixon reconstruction and the dotted line is for the MEM reconstruction.
Figure 12. Light curves for the spatially integrated footpoint source. The solid line is the "true" image, while the dashed line is for the pixon reconstruction and the dotted line is for the MEM reconstruction. The light curve for the other footpoint (not shown) is very similar.
4. Discussion
It is apparent from Figures 1, 4, 7, and 10 that the pixon reconstruction suppresses spurious background sources better than the MEM reconstruction. This is expected since the pixon reconstruction does not allow small spatial scales where the signal to noise is small. While the pixon images look better to the eye, the suppression of the spurious sources also has important implications for the photometry.
Figures 2/3, 5/6, 8/9, and 11/12 demonstrate that the pixon reconstruction gives much better photometry for both the bright footpoint sources and the faint loop top source. This is related to the better spurious background suppression since any counts in the spurious sources must be extracted from real sources. This is a consequence of the approximate flux conservation in a Fourier synthesis reconstruction (see Metcalf et al.). Hence, the spurious sources in the MEM reconstruction result in poor photometry; the MEM algorithm consistently underestimates the brightness of all real sources.
Figures 2, 5, 8, and 11 show another effect for the loop top source. At the peak of the "flare" when the footpoint sources are at a maximum brightness, the loop top source is suppressed. This effect is much more pronounced for the MEM reconstructions. The cause of this suppression is that, in the presence of the very bright footpoints, the loop top source is not statistically significant at the pixel level. In other words, each independent pixel in the loop top source is not bright enough to give a significant effect in the data. However, the loop top source as a whole remains significant. The pixon algorithm has an advantage over the MEM algorithm in this case since the pixon algorithm can (in principle) treat the loop top source as a single pixon whereas the MEM algorithm must treat the loop top source pixel by pixel. This advantage is seen in the figures. Even the pixon algorithm suffers to some extent from the problem, however. The reason is that the current implementation of the pixon algorithm does not have a pixon shape function which exactly matches the loop top source. Hence the loop top source is not a single pixon and the reconstruction suffers somewhat from the same problem as the MEM algorithm, though to a much lesser extent.
The MEM algorithm must use 24 degrees of freedom to reconstruct the 24 loop top pixels while the current implementation of the pixon algorithm uses about 5 degrees of freedom (pixons) to reconstruct the 24 loop top pixels. This could, in principle, be improved. The current implementation of the pixon algorithm is limited to pixons with a circular footprint. However, in the simulations, the loop top source has an oblong rectangular shape which does not match the available shape functions very well. A possible improvement to the pixon algorithm is to allow a larger set of pixon shape functions. For example, elliptical shape functions should provide a better match to the oblong loop top source. This would, however, slow the code appreciably since there would be many more pixon shape functions to choose from. With circular shape functions, the algorithm need only select the best radius. With elliptical shape functions, the algorithm must select the best major and minor radii as well as the best orientation for the ellipse. While this would presumably improve the simulations, it is not clear that this would be a useful tradeoff for real imaging.
When the loop top source is not significant even when treated as a single pixon, the source is more effectively suppressed by the pixon reconstruction than for the MEM reconstruction (Figure 10) . When the loop top source is not significant, the MEM reconstruction places emission at the correct location. At first glance, it may seem that this is an advantage of the MEM algorithm in that it appears to pick up weaker sources. However, upon closer examination, it is clear that the MEM algorithm includes a number of spurious sources at about the same intensity as the loop top source. Hence, in a real situation where "truth" is not known, it would be impossible to determine which, if any, of the weak sources were real. Hence, the suppression of marginal sources must be considered an advantage of the pixon reconstruction.
One effect I expected to see in the simulations was the tendency for the faint loop top source to mimic the bright footpoint sources in the MEM reconstructions. This behavior would be caused by the maximum entropy criterion forcing all sources to have intensities which are as equal as possible, within the requirements of the data. This is expected since equal sources have more entropy than sources with very different intensities. While this may happen in some cases, there is no evidence of this type of behavior in the simulations.
As demonstrated by the HXT simulations, the pixon algorithm is preferable to the MEM algorithm in situations where photometry is important. However, the pixon algorithm is considerably slower than the MEM algorithm (at least an order of magnitude). This is to be expected since the pixon algorithm must, in effect, do a constrained MEM reconstruction at each pixon size. Further, the pixon algorithm must compute a new pixon map after each MEM reconstruction. Hence, in situations where photometry is not important, the MEM algorithm is preferable. There is considerable room for improvement in the pixon algorithm when speed is an issue. It may be possible to make the pixon algorithm more efficient, a clear direction for future research.
5. Implications for the Masuda Event
From the discussion in section 4, it is clear how the HXT reconstructions behave when both a very bright source and a very faint source are in the same field-of-view. When the bright footpoints are at peak brightness in the Masuda event, the loop top source is not significant at the pixel level and is only marginally significant as a single source. Hence we should expect the loop top light curve to behave like that seen in (Figure 11): at the peak of the flare the loop top source will be suppressed and fall towards zero intensity, regardless of the what the real source is doing. The loop top source cannot be detected in the presence of the very bright footpoint emission. A pixon reconstruction of the Masuda event shows essentially this behavior.
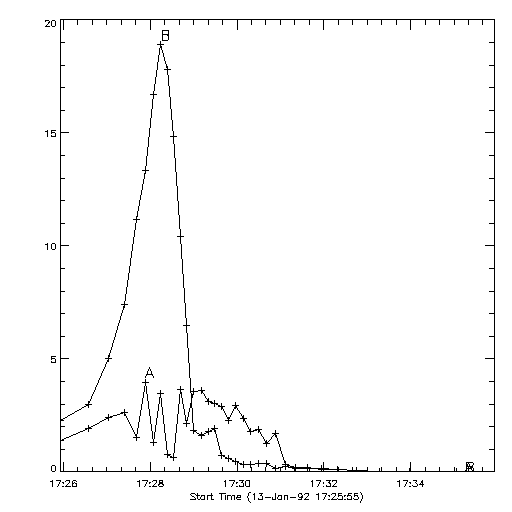
Figure 13. M1 Lightcurves (counts per second vs. time) derived from the pixon reconstructions for the Masuda event of 1992 January 13. "A" is the loop top source and "B" is summation of the two footpoints. The loop top source gradually increases in brightness until 17:27:20 UT at which point it becomes hard to detect in the presence of the bright footpoints. From 17:27:20 UT through 17:29:00 UT, the loop top source as a whole is only marginally significant and the light curve is very noisy. Note that, at the pixel level, the loop top source is not at all significant during this interval. This figure was generated using accum_counts=400 in hxt_multimg.pro to give about 400 counts per subcollimator in each image (in the LO channel).
In Figure 13, the lightcurve for the loop top source becomes quite noisy during the peak of the flare when the footpoint emission is brightest. It is interesting that the loop top source is not completely suppressed at the flare peak. Rather, the light curve appears quite noisy. This may be caused by the fact that the source is at the edge of detectability. During the time period when the loop top source is not significant, the HXT data used in the image reconstruction is not sufficient to determine whether the loop top emission has an impulsive component. Clearly, before and after the impulsive phase of the flare, there is a gradual component present. Presumably this gradual component continues throughout the impulsive phase. The question remains, however, whether there is also an impulsive component present during the peak of the flare. A longer time integration can help resolve this question:
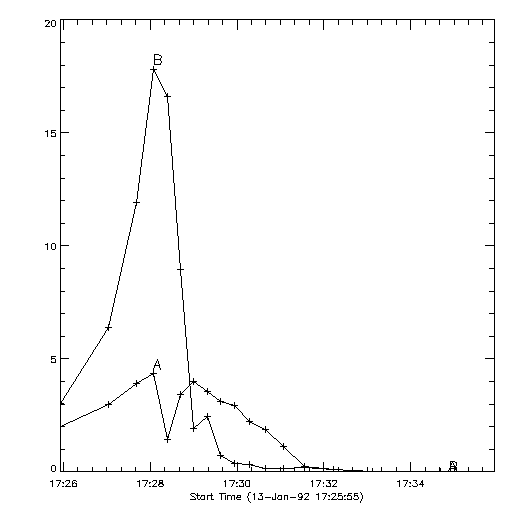
Figure 14. M1 Lightcurves (counts per second vs. time) derived from the pixon reconstructions for the Masuda event of 1992 January 13. "A" is the loop top source and "B" is summation of the two footpoints. This reconstruction uses an integration which yields twice the counts per image in Figure 13 (in the LO channel). The longer integration reduces the noise during the peak of the flare as expected. This figure was generated using accum_counts=800 in hxt_multimg.pro to give about 800 counts per subcollimator in each image (in the LO channel).
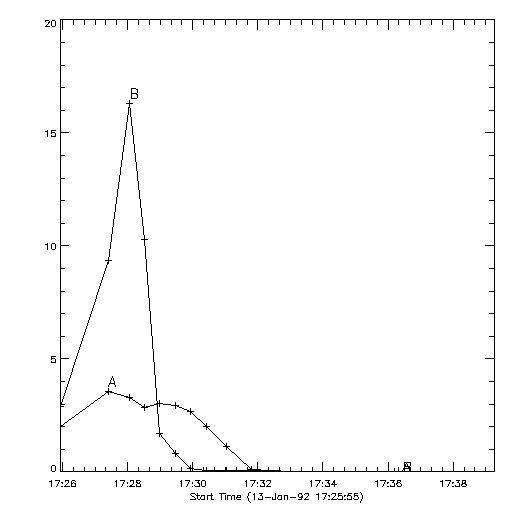
Figure 15. M1 Lightcurves (counts per second vs. time) derived from the pixon reconstructions for the Masuda event of 1992 January 13. "A" is the loop top source and "B" is summation of the two footpoints. This reconstruction uses an integration which yields three times the counts per image in Figure 13 (in the LO channel). The longer integration reduces the noise during the peak of the flare as expected. This figure was generated using accum_counts=1200 in hxt_multimg.pro to give about 1200 counts per subcollimator in each image (in the LO channel).
Figure 14 and Figure 15 show reconstructions with two and three times the counts per image as the reconstruction in Figure 13. With the longer time integration, the noise in the light curves is reduced during the peak of the flare. While there are still several points at the peak which are not significant in Figure 14, in Figure 15, it is clear that there is not an impulsive component to the loop top light curve during the impulsive phase.
6. Conclusions
5. References