Looking at the Sun
When Astronomers began to watch the Sun in a systematic manner,
they generally used pen and paper to record what the Sun looked like,
and how it changed over time. For example, Galileo and other astronomers
of his time (ca 1610) recorded the appearance and movement of sunspots across
the solar disk:
see examples of Galileo's drawings.
The early astronomers actually looked directly at the Sun, even using
telescopes to see it better. Since the sun is extremely bright, this
dangerous method lead to vision problems (and can lead to blindness).
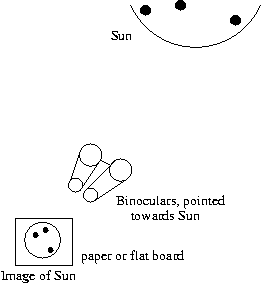
The projection method was
developed to shine an image of the Sun onto
a flat surface with which detailed inspection could be made.
This is still the safest way to view the sun, and anyone can do it with
a pair of binoculars, as demonstrated at left.
 Drawings from the projections of the Sun were eventually replaced by
photographic plates and film on which images of the sun could be saved for
later analysis.
As telescopes have become larger and the resulting observations of the
Sun more detailed, the devices used to "photograph" and analyze the
light from the sun have become much more sophisticated.
In recent decades, photographic film has been replaced by electronic
chips - similar to those in video cameras - and the images of the
sun can be stored and analyzed at the scientist's request.
Solar Telescopes
Most people think of telescopes as being used to observe the moon,
planets, stars and galaxies - objects generally seen at night.
Some telescopes, however, are specially designed to observe the Sun.
The Sun is much brighter than any star or galaxy, and focusing
so much light results in tremendous heat (one can demonstrate this
by focusing sunlight onto a piece of paper using a magnifying glass -
carefully!). The advantage of observing this nearby star with
a telescope is that the image made by the telescope can be very
large -- and the bits that can be seen are thus very very small.
Such as a bigger pair of binoculars allows one to view the tiniest
feather on a bird, a larger telescope allows one to view very small
pieces of the sun, pieces only 100km across (about the size
of a large city), on a star 1.5x10^8km away.
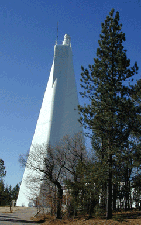
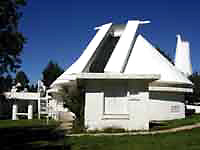
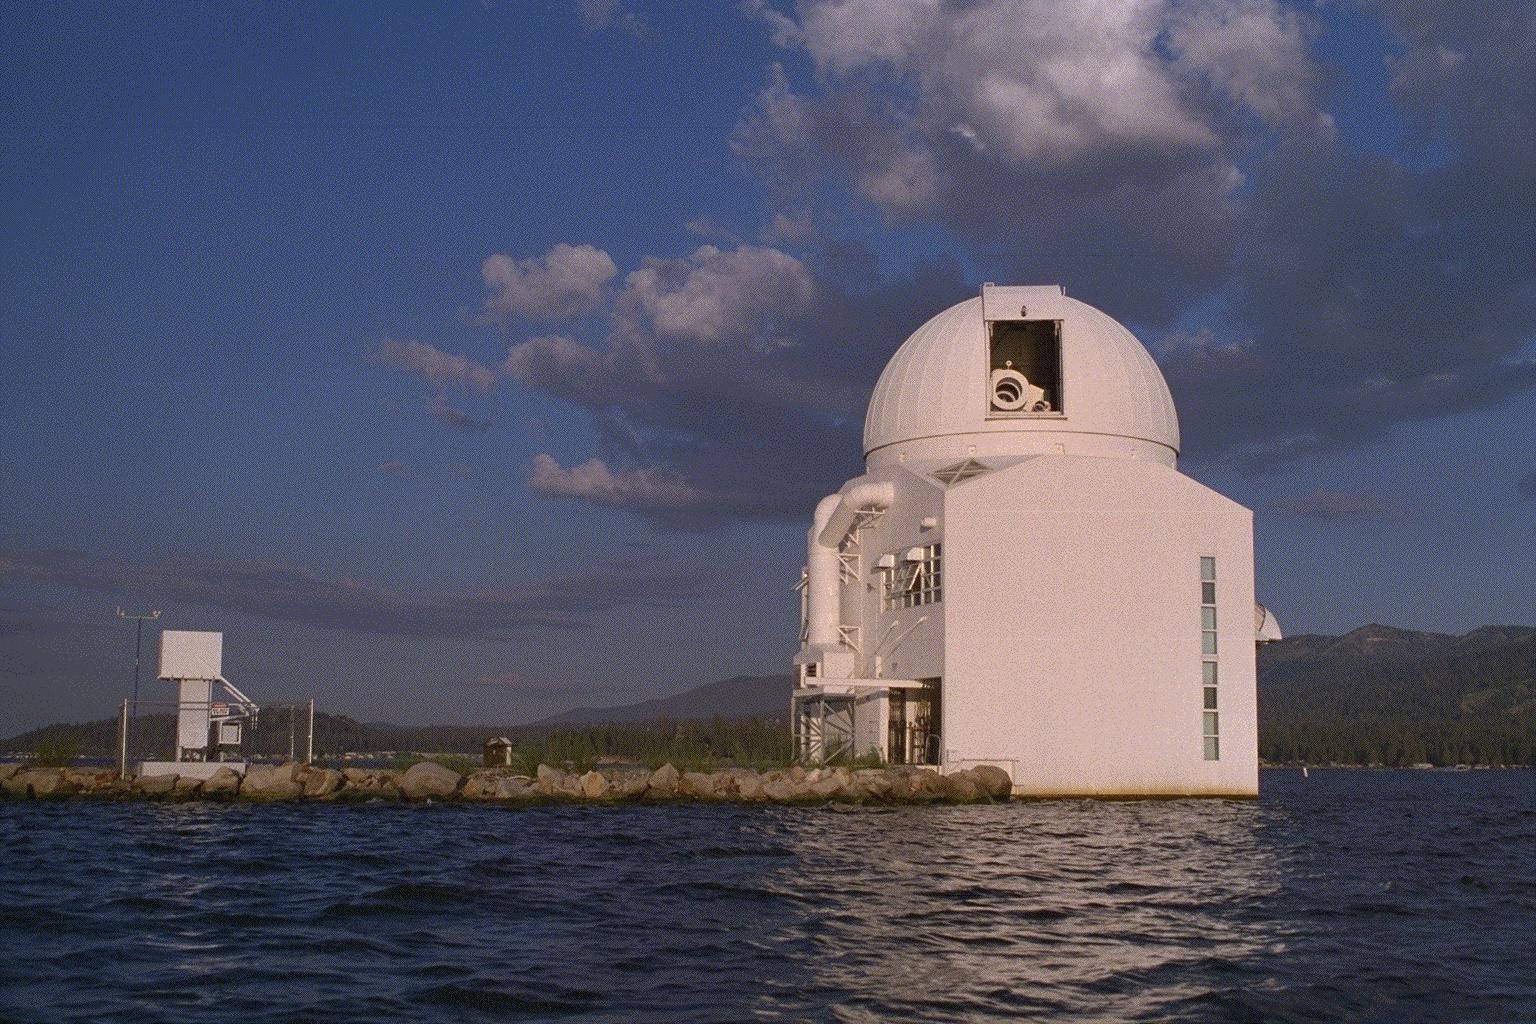
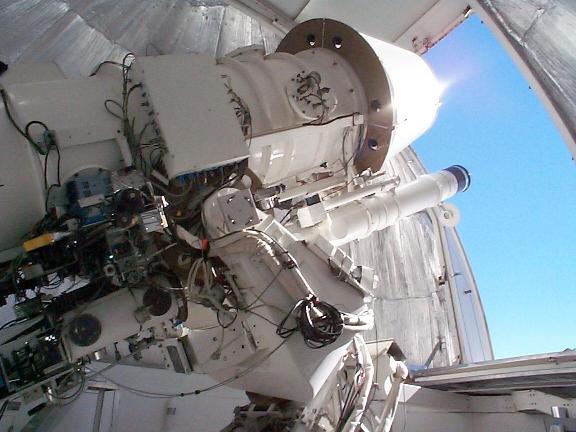
Solar telescopes can be small or large, depending on how small
a piece of the sun they are designed to "zoom" in on.
Some examples are the telescopes at
National Solar Observatory and the
Big Bear Solar Observatory ,
as pictured here.
The telescopes are very precise. They can point at a specific
target (a particular sunspot, for example) on the Sun and keep that
target in view for many hours at a time. To do this many computers
are used to precisely move the telescope, the dome, and keep them
moving in synch with the motion of the sun across the sky
(as well as its own rotation).
While early telescopes were positioned by hand, today computers perform
those tasks. With computers, the motors and machines that move the telescope
can be driven and positioned with much greater precision than by hand.
Have you ever noticed stars twinkle? The twinkling is caused by
turbulence in the solar atmosphere, and makes a pinpoint of light
such as a star seem large and blurred. Twinkling occurs during
the day, too, and makes an image of a sunspot, for example, blurry
(like looking under water). With computers it is now possible
to correct the effects of atmospheric blurring. Special observations
can be made to correct images after-the-fact; alternatively,
telescopes are being designed which themselves compensate for the
atmospheric distortions by distorting the mirrors of the telescope
itself, an approach called
adaptive optics.
Doing Science with Solar Telescopes
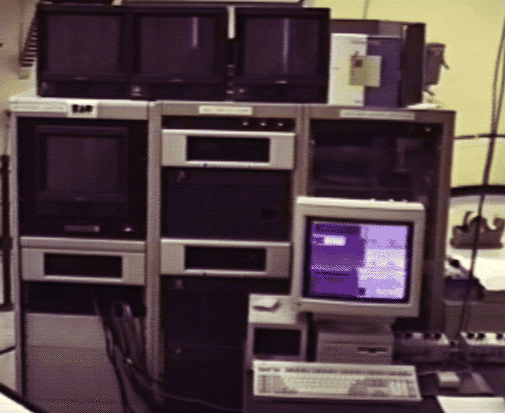
To address the scientific questions of interest today, a researcher
uses sophisticated tools -- far beyond the sunspot drawings of
Galileo's time. Solar telescopes are only part of the observing
package; specialized instruments are attached to the telescope
which "repackage" the light from the sun in a manner required
to address the question.
An 'instrument' is a series of optics (lenses, mirrors, polarizers,
spectrographs, filters) which "slice and dice" the incoming light --
arranged to produce an in-focus image on the digital camera.
The lenses, mirrors, etc. are all controlled by computers to allow
very precise, very minute adjustments in order to obtain the very best
data and/or to provide a range of options for the investigator to use.
In this way, changes can be made to the system which are smaller
than one could do by hand, and it can be precisely repeated over & over again.
The solar atmosphere also changes on timescales as short as milliseconds.
To record the changes that fast requires very fast cameras and
shutter speeds. As the best photography equipment is computer-controlled,
so are electronic recording equipment that record the data from solar
telescopes are computer-controlled.
The data are recorded (again, using the computers) on hard-disks
and often onto magnetic tape such as 8mm tape (the same kind that are used
in video cameras, although the data are digital, not simply a movie).
Light from the sun looks white - but if it passes through a prism
(or off the back of a CD-ROM), it takes on the colors of the rainbow.
This rainbow is the solar spectrum,
 the conglomeration of light emitted (and absorbed) by many different
elements such as Hydrogen, Helium, Carbon, Iron, Silicon, etc. Looking with
more and more detail, the rainbow has dark lines, where the elements
absorb light; the shape of these absorption lines can be changed depending
on the solar atmosphere itself -- its temperature, density, motion, etc.
Analysis of the spectral lines, called "spectroscopy",
is one way scientists infer what the Sun is like, even without going there
and measuring the temperature for example, directly with a thermometer.
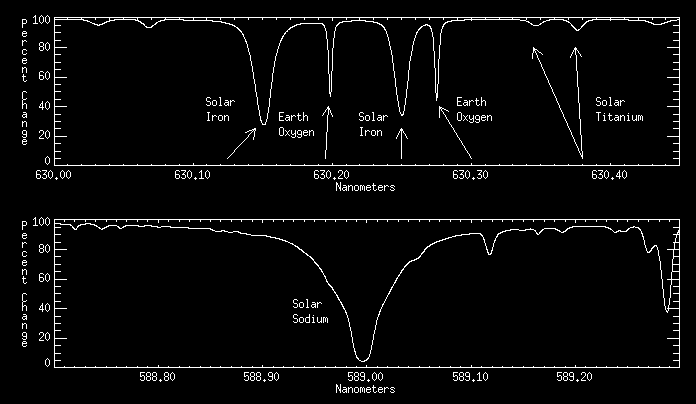
Below is a plot of the intensity of light as a function of wavelength,
first across some of the smaller and narrower lines in a red part
of the spectrum, and second across the Sodium D-line which is
in the yellow/orange part of the spectrum (and is visible in the
rainbow above).
 The analysis is done
these days with computers, constructing computer models of
the atmosphere, predicting what the resulting spectral lines would
look like, and comparing them to the observations.
Scientists often want to examine large parts of the Solar surface
using simply pictures -- although these are usually specialized
pictures where the light used to make the image is only the light
from a small part of the solar spectrum (e.g. that from only one
element).
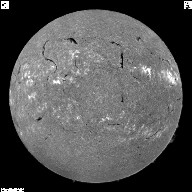
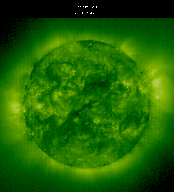
Below are examples of what the Sun looks like in integrated light
(as it would look using the projection method), in the light
of a Hydrogen spectral line in the red part of the spectrum, and
in the ultra-violet line of Iron. These three images
show (left to right) the solar Photosphere (its "surface"),
the Chromosphere (about 1,000 km above the photosphere), and
the Corona, or the outer atmosphere of the Sun.
 A computer enables scientists to view the motions and changes
on the sun, comparing what is occurring in the light from one spectral
line to that occurring in another -- or one time compared to another.
In the example here, the pictures are from a spacecraft
called the Solar and Heliospheric Observatory ("SoHO"); like any space
mission, computers run the show from the launch of the rocket to
running the electronics on-board to take the pictures of the Sun,
downloading data to the Earth, then to the detailed scientific analysis
of the data.
Even after the raw data from the telescope are on the scientist's computer
disks or tapes, the work has just begun.
After the observations are made, the computers play a crucial role.
The first goal is to make sure everything that is recorded in the
images or spectra is in fact from the Sun. In the "raw" data, some
objects end up being "false", or artifacts which should be removed
since they do not reflect the true situation on the Sun -- this is
similar to wanting to remove "red-eye" in photos of friends since it is
clearly not their true eye color and is in fact a result of the
operation of your camera and the light in the room.
The goal is to take the observations and remove anything which is not of solar
origin, i.e. remove any effects from the earth's atmosphere (the twinkling
and blurring), and the instrument used to observe in the first place
(dust, etc). Below we show a series of images from the
Imaging Vector Magnetograph at
Mees Solar Observatory , demonstrating the processing which
is done, using computers, to get the best data possible. From
left to right, a raw image straight from the telescope and its
digital camera, the same image with some artifacts from the telescope
removed (notice the wavey "fringes" and some of the dark spots are
gone), and finally the same image with some effects of the
earth's atmosphere removed for a clear picture of the sunspots.

Once the data are 'clean' and only contain information of Solar origin,
then the scientific analysis can truly begin. As mentioned above,
by using the solar spectra one may study changes in the physical state
of the solar atmosphere, for example the up- and down- velocities.
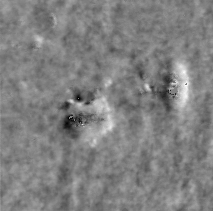
In this example, the image above has been combined with others in
different part of a spectral line (one of the narrow Iron lines profiled
above) to derive a map of the velocities in the region of these sunspots
(dark/black is flowing down into the Sun, light/white flows up).
Taking data for extended
periods of time allows us to study long-term changes in the Sun such as those
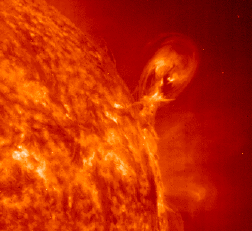
that occur with the 11-year Solar activity cycle. Obtaining Solar data
very fast allows us to study short-term changes and explosive events such as
solar flares
and Coronal Mass Ejections. Click on these images to view movies
of the Sun in action.
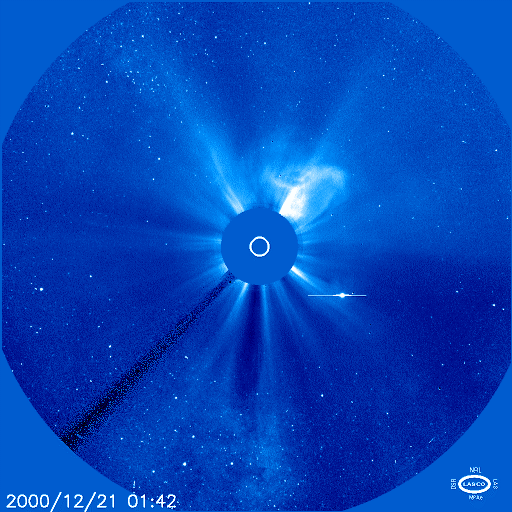
If scientists
wish to understand how the Sun changes and its effects on Earth, we observe,
analyze, and store observations of the Sun using computers both on Earth and in space.
This page authored by K.D. Leka
 Drawings from the projections of the Sun were eventually replaced by
photographic plates and film on which images of the sun could be saved for
later analysis.


